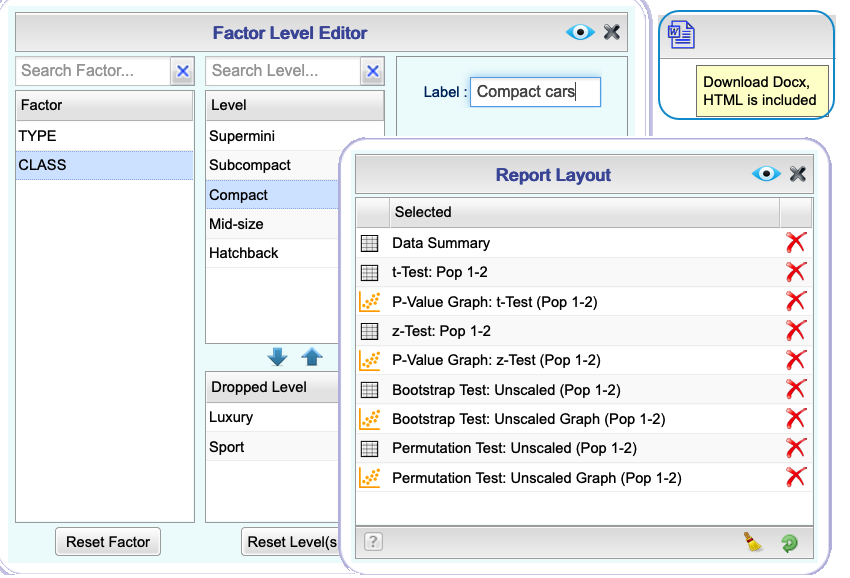
Rguroo’s Analytics functions provide tools for applying classical and modern statistical methods. Each function consists of a “Basics” and a “Details” dialog box. The “Basics” dialog boxes provide access to commonly used methods. The “Details” dialog boxes include advanced methods and allow for setting tuning parameters where needed. A “Level Editor” in each function enables you to control levels of the factors (categorical variables). You can (re-)label levels, add or remove levels from an analysis, or reorder levels.
Rguroo reports are displayed in your web-browser within the application. They include presentation-quality graphs and tables. The “Report Layout” menu in each function lets you customize the output by reordering or removing the output elements. You can export reports to Microsoft Word. Moreover, all graphs in a report are exportable as standalone png files. A standalone HTML version of the report can also be exported.
Statistical Analysis

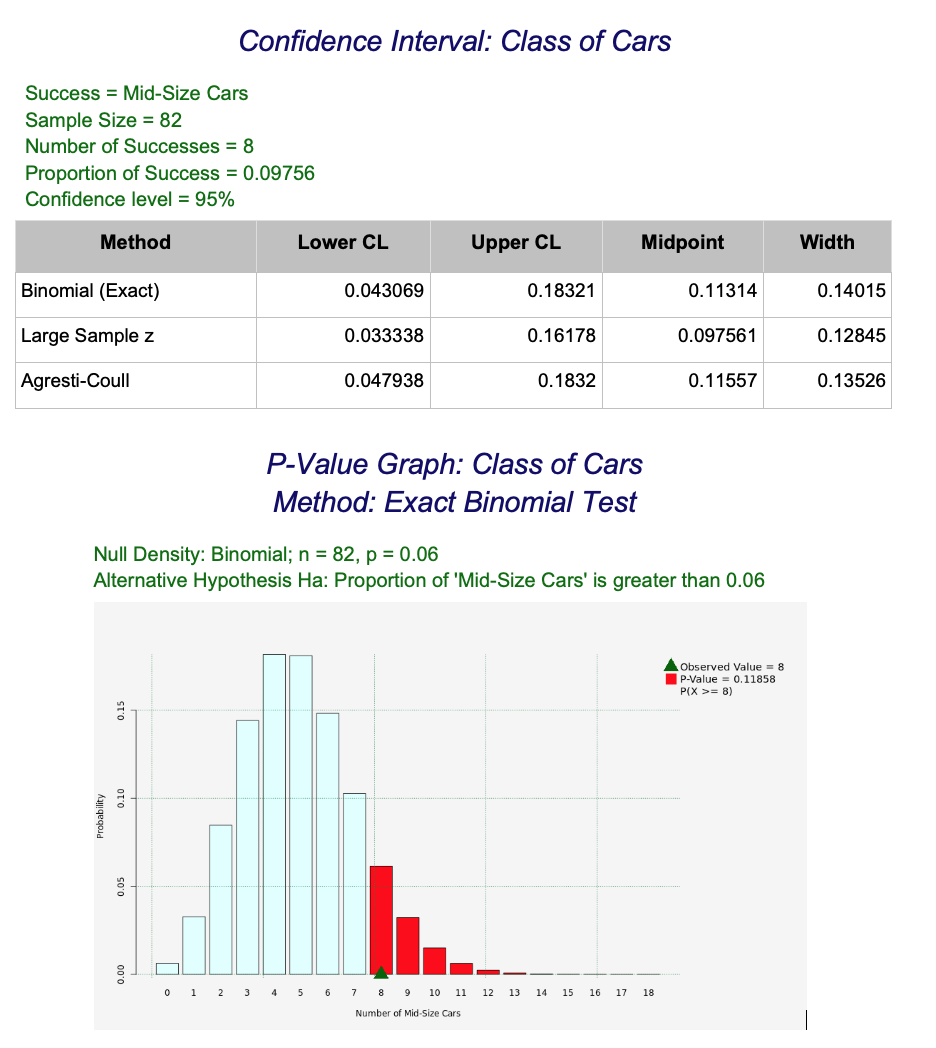
Proportion Inference
Construct confidence intervals and test hypotheses for a single population proportion or difference of two population proportions.
Use summary statistics or raw data for your analyses.
Use the basic large sample Z or the exact binomial methods for one population proportion inference, or use more advanced methods of Agresti-Coull, or Wilson Score.
Use large sample Z for two population inference, or use more advanced methods of Wilson Score, Fisher Exact test, or Chi-Squared test.
Examine the normality assumption using normal probability plots or the Shapiro-Wilk Test of normality.
Perform Power analysis.
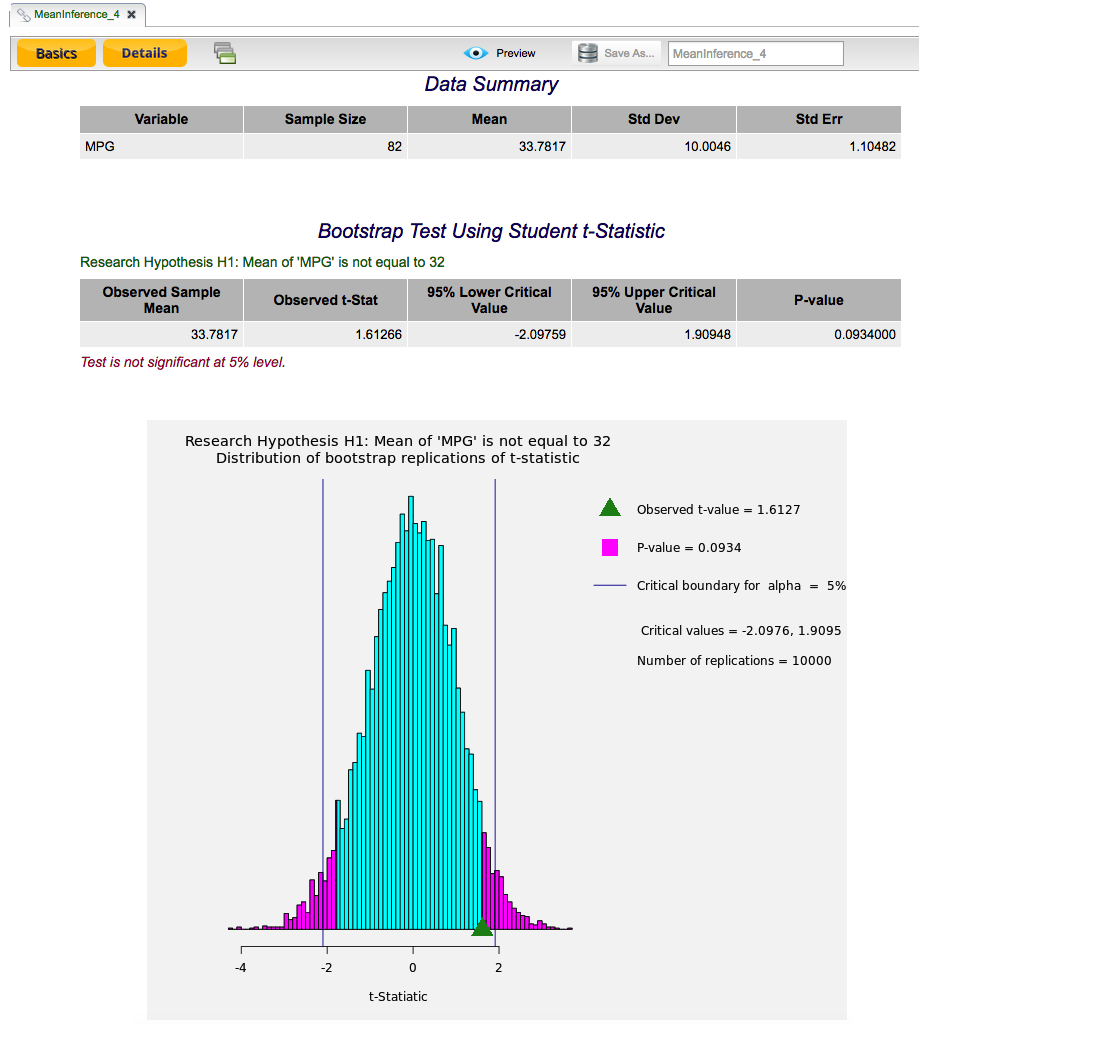
Mean Inference
Construct confidence intervals and test hypotheses for a single population mean or difference of two population means.
Use summary statistics or raw data for your analyses.
Use the commonly used methods of large sample Z or Student t statistic. Alternatively, use simulation-based methods such as bootstrap or permutation test.
Test normality assumptions or equality of variances for the two-populations, and use the corresponding appropriate test statistic.
Perform Power analysis for the mean of one population or the difference of two population means.
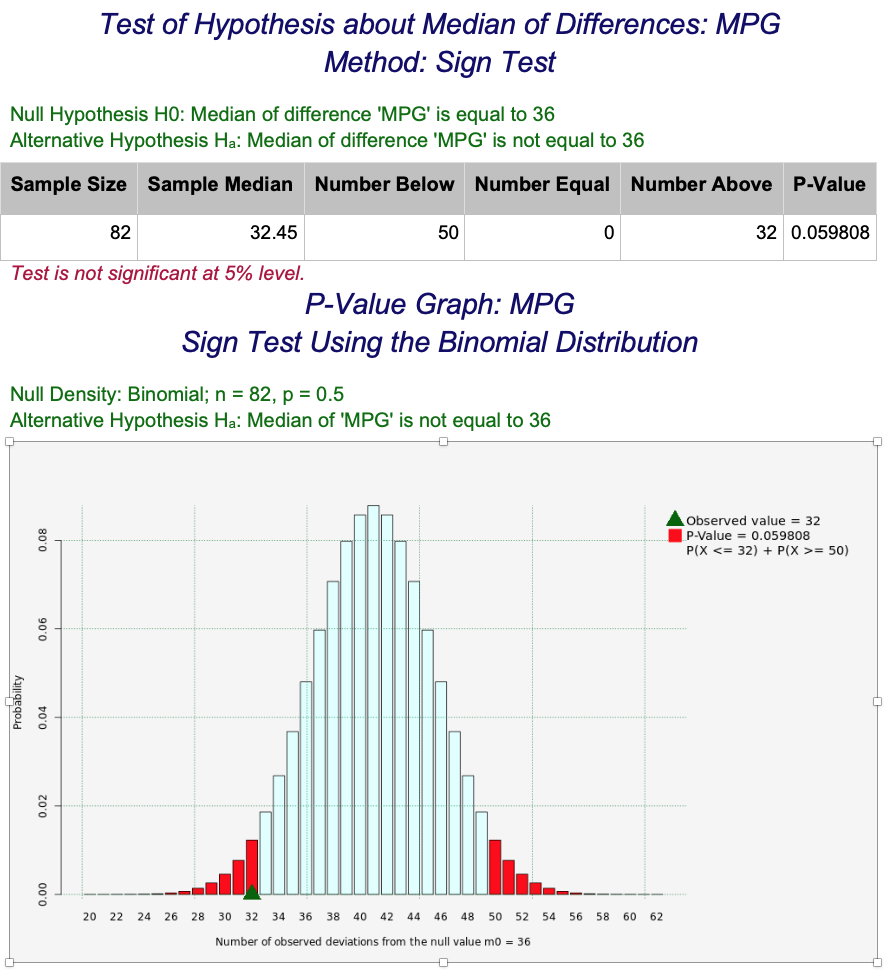
Median Inference (Nonparametric Methods)
Test hypotheses about a single population median using Sign Test or Wilcoxon Signed-Rank test. Construct confidence intervals about a single population median using the Binomial, Wilcoxon, or Bootstrap methods.
Apply methods of Sign test, Wilcoxon Signed-Rank, Mann-Whitney, and permutation test to make inference about two population for independent or paired data.
Apply methods of Binomial, Wilcoxon, Mann-Whitney, or bootstrap to construct confidence intervals for two populations based on independent or paired data.
Examine the normality assumption using normal probability plots or the Shapiro-Wilk Test of normality.
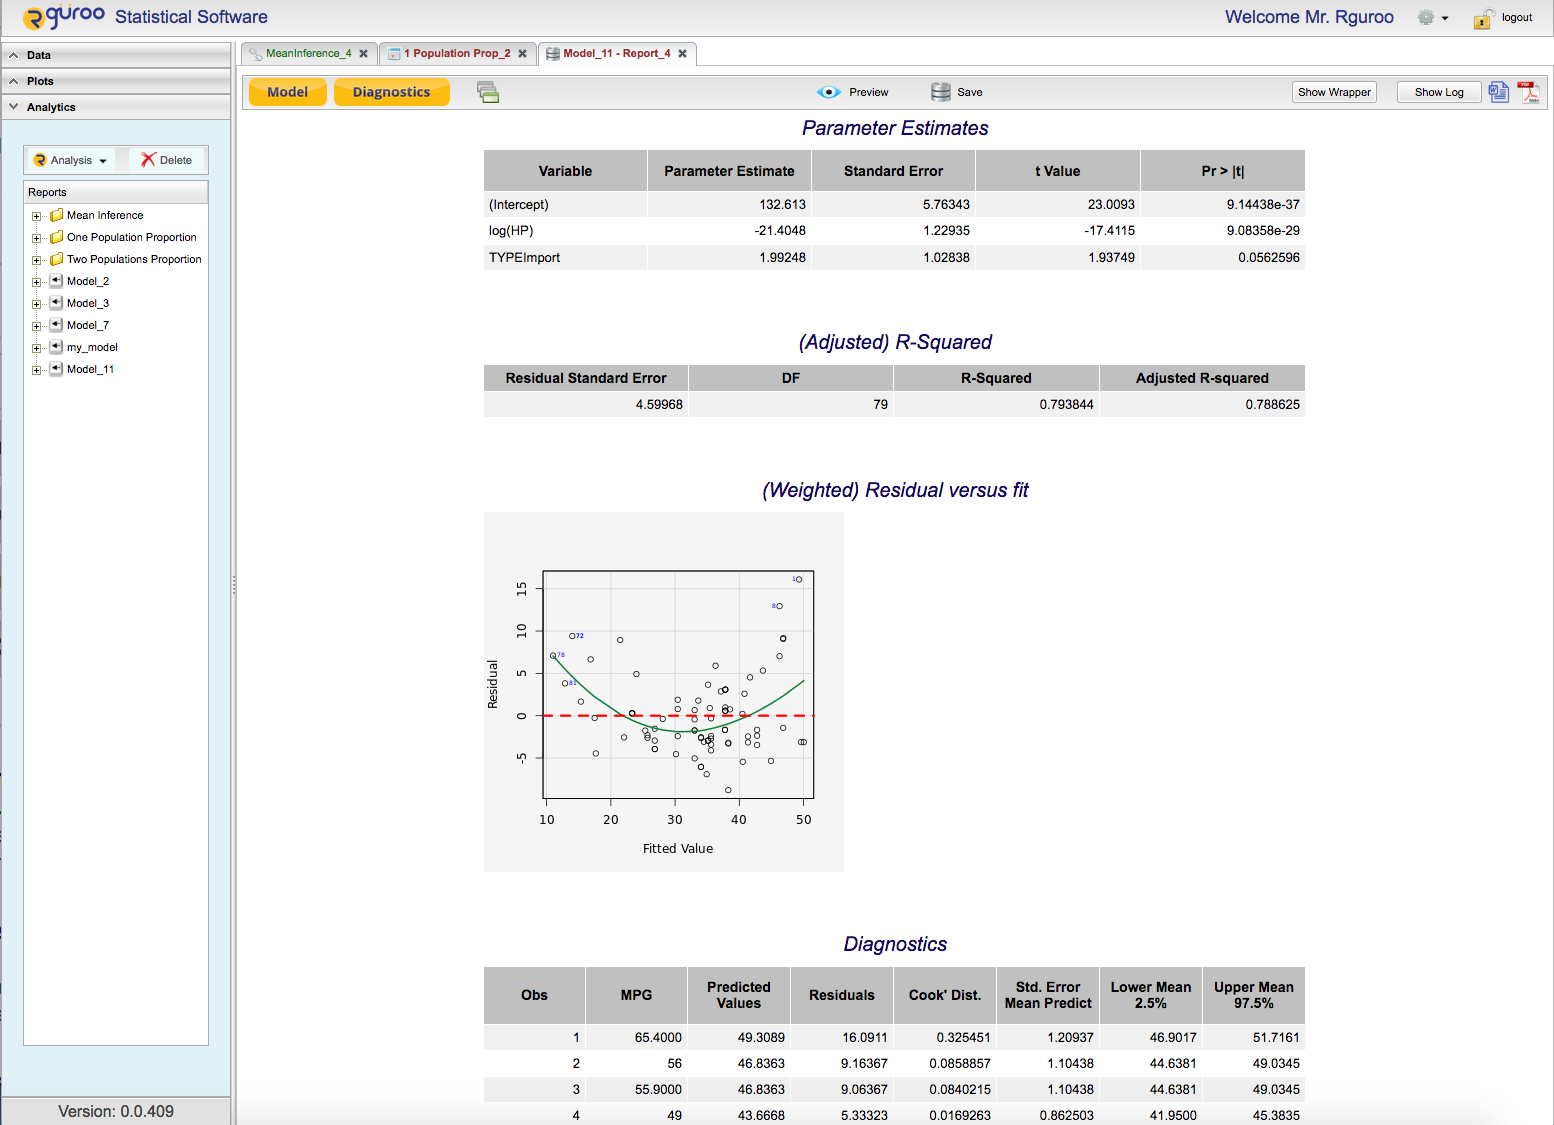
Linear Regression
Fit simple or multiple linear regression models, including numerical or categorical predictors.
Transform the response or predictor variables
Fit Weighted regression models.
Fit a separate regression model to each level of a categorical variable.
Use a rich suite of model diagnostics, including informative graphs, to check your models.
Save your diagnostics indices in separate data files to export or to use in other Rguroo functions.
Obtain predictions, prediction intervals, and confidence intervals for mean prediction for the data uses in the model and external data.
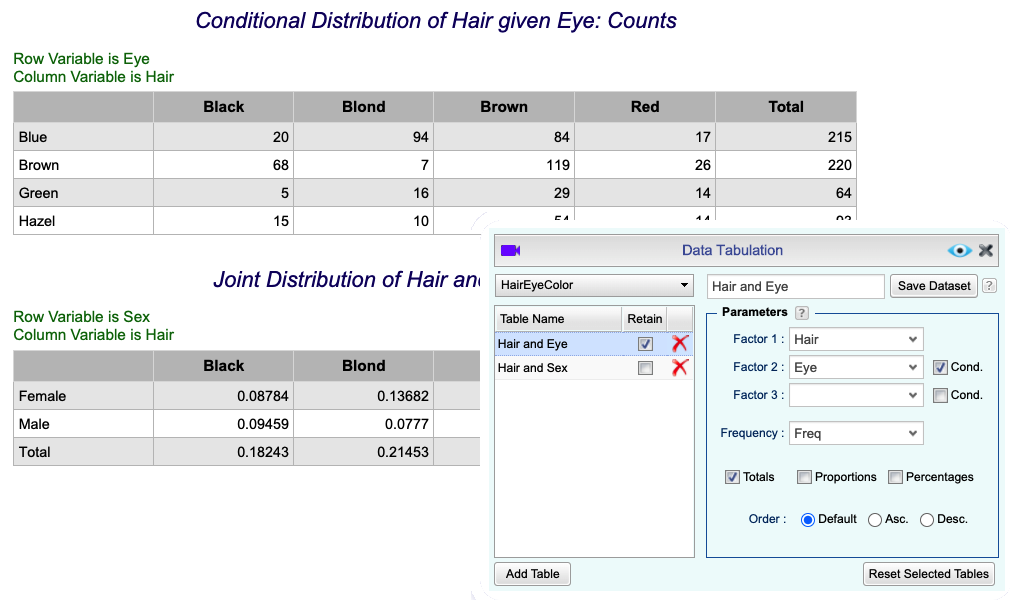
Tabulation
Tabulate your categorical variable to obtain counts, proportions, or percentages for each level.
Obtain one-way, two-way, or three-way tables.
Obtain joint or conditional distributions.
Save your tables to graph the values or perform other analyses using other Rguroo functions.
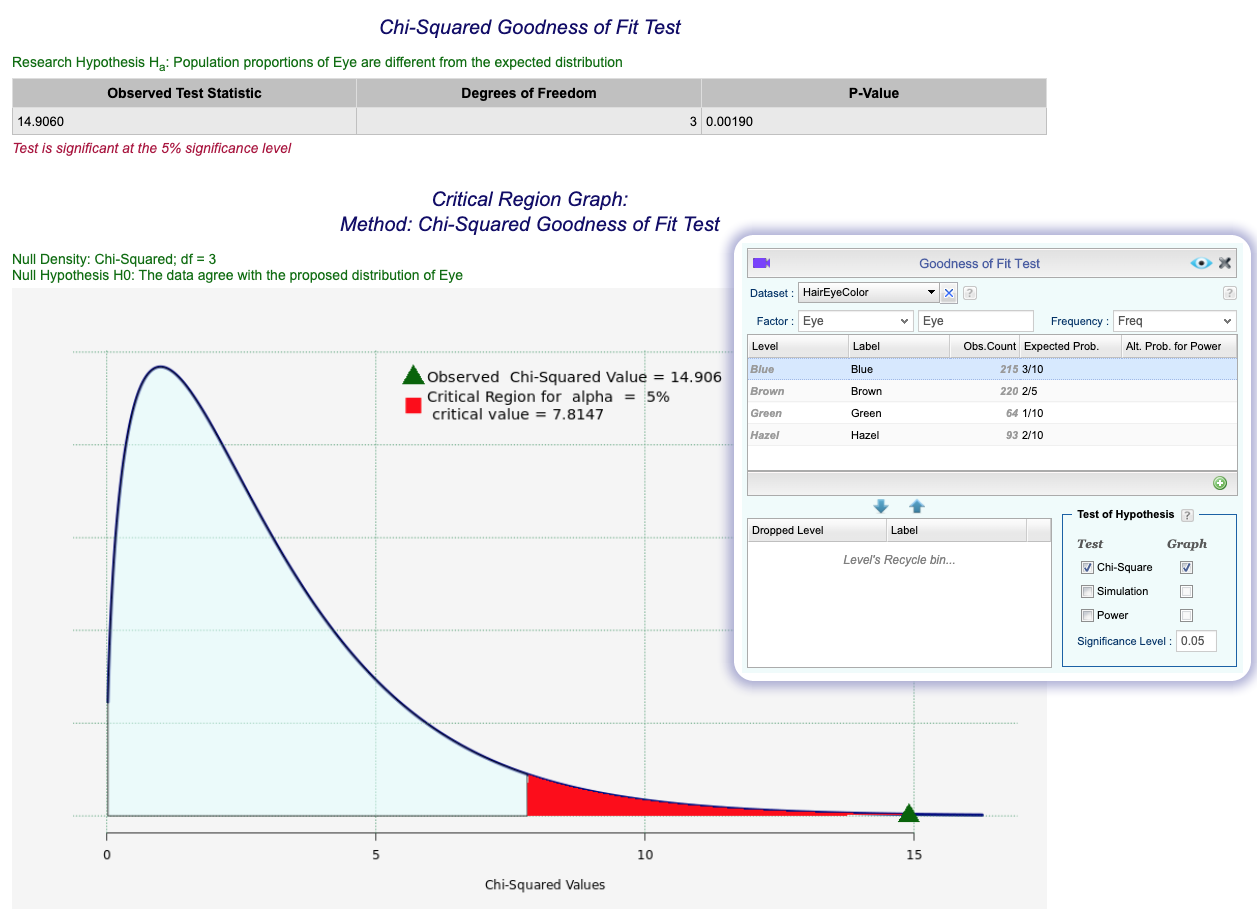
Goodness of Fit
Perform goodness of fit test by uploading raw data, frequency tables, or inputting data manually.
Input null values as probabilities or odds.
Apply chi-squared or simulation0based methods.
Conduct Power analysis.
Get diagnostics such as residuals, or contribution of each cell to the chi-squares statistics.
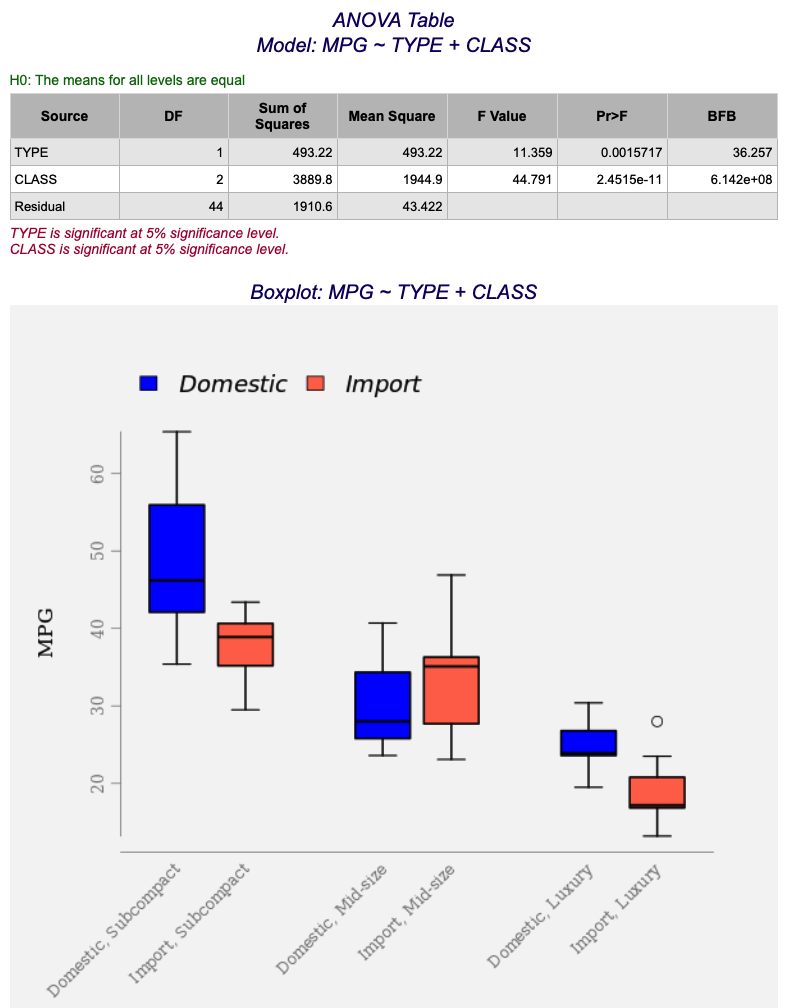
Analysis of Variance (ANOVA)
Perform one-way and two-way fixed effect ANOVA.
Perform one-way and two-way random effect ANOVA.
Obtain diagnostic plots and indices.
Perform post-hoc tests of Tukey’s HSD or Pairwise Student t.
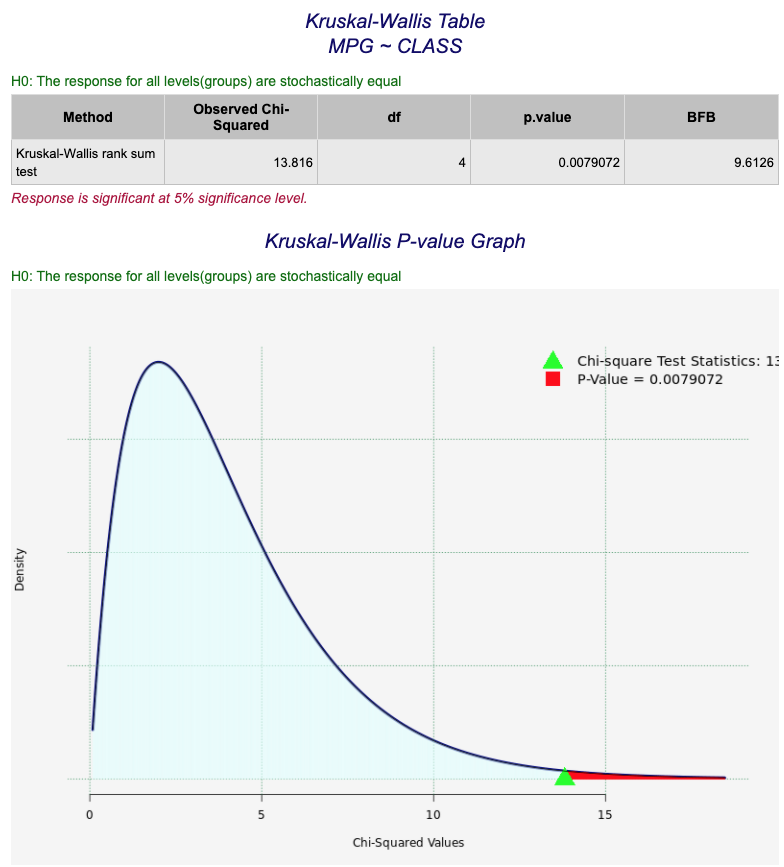
Nonparametric Analysis of Variance (ANOVA)
Perform one-way and two-way non-parametric ANOVA.
For the one-way analysis use, the Kruskal-Wallis test or permutation test.
For two-way models, perform the Friedman test or permutation test.
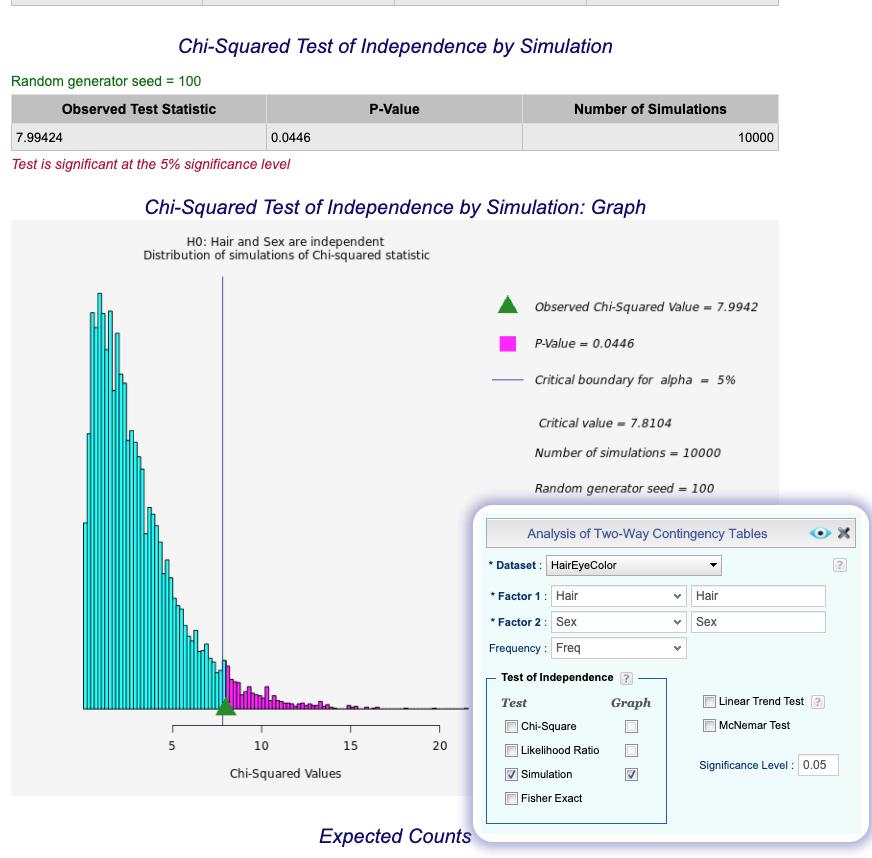
Analysis of Contingency Tables
Perform analysis of contingency tables using raw data or tabulated data.
Conduct a test of independence using one or more of the following methods: Chi-square test, Likelihood ratio test, Simulation-based test, Fisher Exact test.
Perform Linear Trend Test or McNemar Test.
Obtain diagnostics values.
Utilities
Customize your output using the Report Layout option.
Export your reports to Word.
Export images from your reports as standalone png files
Use the Level Editor to relabel, reorder, or add/remove levels of a factor.